
A liquidity sweep, failed breakout, and genuine breakout can all begin with the same first observation: price trades beyond a level traders were watching. The distinction develops afterward through acceptance, rejection, follow-through, and the structure that forms next. Inside The Market, the goal is to describe what price actually proved before adding a story about why the move happened.
That same evidence-first approach is central to Smart Money Concepts Explained.
The same restraint helps when reading popular ICT terminology around sweeps, structure, and displacement.
Start With the Level, Not the Story
Prior swing highs and lows, previous-day extremes, overnight highs and lows, equal highs and lows, and range boundaries can matter because many traders can see them. Those visible references may attract breakout entries, protective stops, limit orders, profit-taking, and other decisions. That makes them useful locations without proving exactly which orders are waiting there or who placed them.
Traders commonly use buy-side liquidity for potential buying activity above prior highs and sell-side liquidity for potential selling activity below prior lows. Those phrases can help organize location, but they are not an X-ray of the market's stop book. A prior high may be an obvious place where orders cluster without revealing their exact size, ownership, or purpose.
Protective stop orders also should not be confused with ordinary resting limit orders displayed in market depth. A chart or normal DOM cannot simply show every stop waiting above a high or below a low. Obvious levels attract attention; attention can create order concentration; neither tells you everybody's motive.
What Traders Mean by a Liquidity Sweep
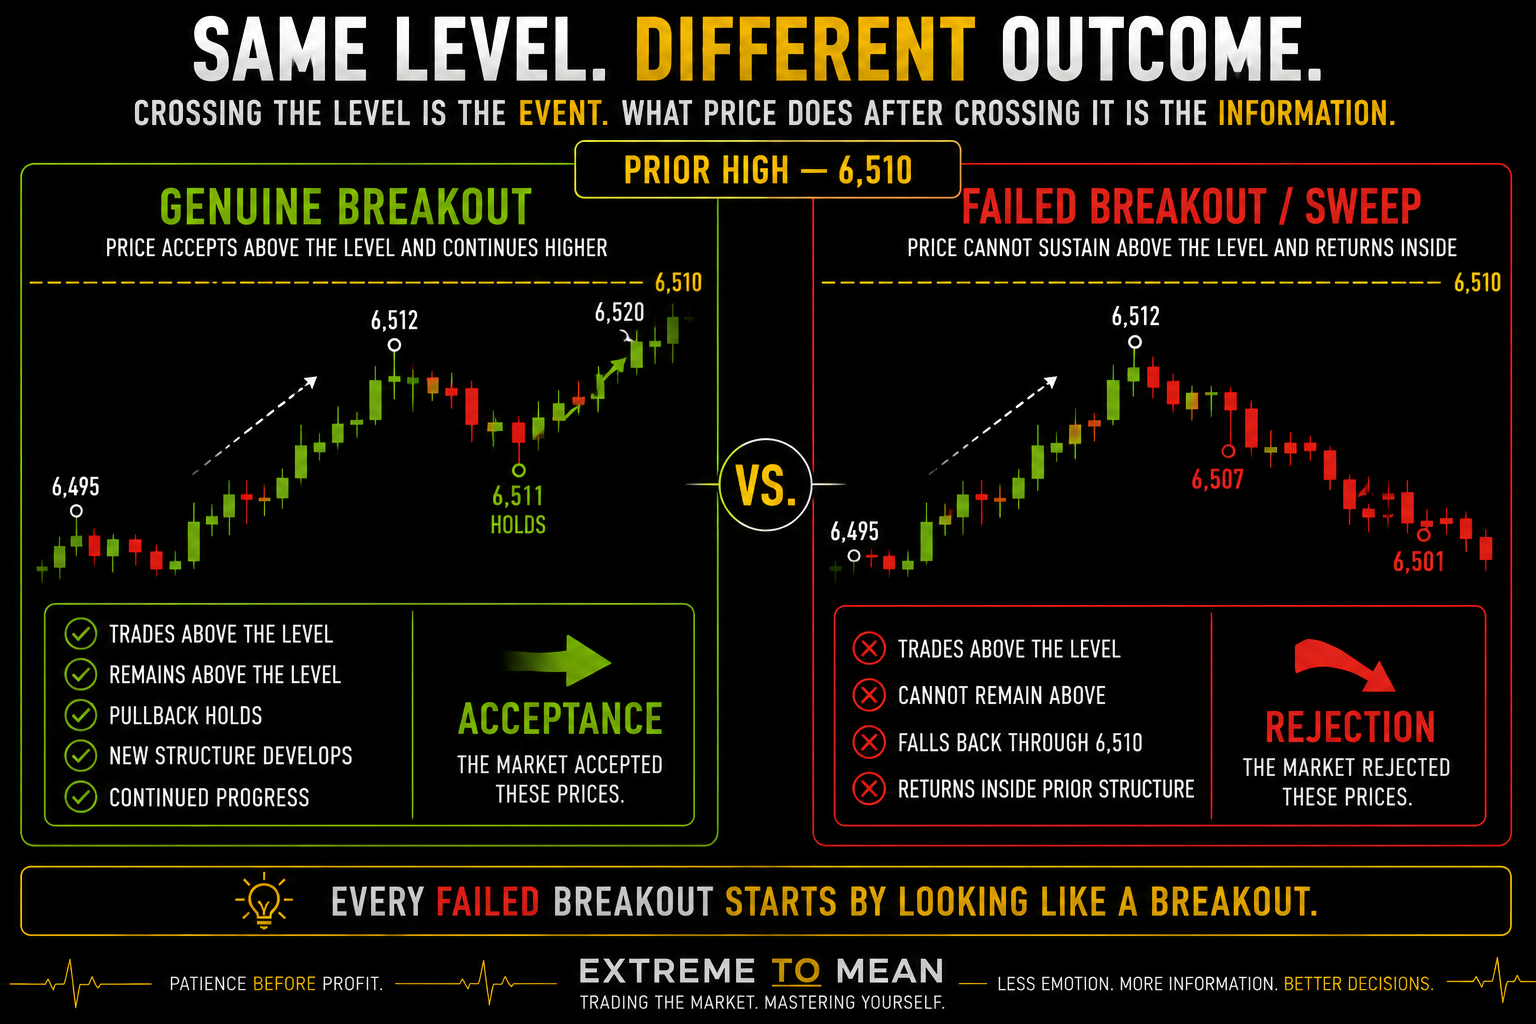
Imagine ES has a prior high at 6,510. Price rallies from 6,495, trades to 6,512, then falls back through 6,510 and continues to 6,507 and 6,501. Traders may call that a buy-side liquidity sweep, a liquidity grab, or a failed breakout above the prior high.
The observable facts are simpler than the labels. ES traded beyond a known reference, failed to sustain trade there, and returned beneath it. The chart does not prove that one institution engineered the move, every stop above the high was triggered, or the reversal must now continue.
The same idea works below a low. If NQ trades beneath a prior swing low, quickly reclaims it, and begins holding back inside the previous structure, traders may call it a sell-side liquidity sweep or failed breakdown. Observable price behavior comes first; interpretation comes second.
Liquidity Sweep vs. Failed Breakout
The terms overlap without being perfectly identical. A failed breakout is the broader description: price attempted to establish beyond a level and could not sustain the move. A liquidity sweep is usually a more specific trader-community interpretation of a failed excursion through an obvious high, low, or liquidity reference.
That distinction keeps the language grounded. A breakout can fail for many interacting reasons, and the chart usually cannot identify one invisible cause with certainty. Many liquidity sweeps can be described objectively as failed breakouts; not every failed breakout needs a liquidity-sweep story.
Genuine Breakout vs. Sweep
Every failed breakout initially has to look like a breakout. When ES first trades above 6,510, the trader does not yet know whether price will hold above the level and continue—or fall straight back into the prior range. The useful information develops after the first crossing.
A genuine breakout tends to show more evidence of acceptance beyond the level. Price may spend more time there, continue making progress, hold a retest, or begin constructing new structure outside the old boundary. A failed breakout or sweep tends to show rejection: limited progress, inability to stay outside, and a return through prior structure.
No single candle, volume spike, or retest guarantees which outcome is developing. The better question is whether the market is demonstrating continued trade beyond the level or rejecting those prices. That is where the acceptance-and-rejection framework from Auction Market Theory becomes more useful than a story about who “needed” liquidity.
Wick, Close, and the Size of the Excursion
A wick through a prior high followed by a close back beneath it is a visually clean sweep example, but a wick is not required for every failed breakout. Price can close slightly beyond a level, spend several bars there, and still fail later. The broader concept is failed acceptance beyond the reference, not one mandatory candle pattern.
There is also no universal number of ticks or percentage distance that separates a sweep from a genuine breakout. Some communities distinguish “liquidity grab” from “liquidity sweep,” while others use the terms interchangeably. ETM should not manufacture precision where the terminology itself is informal.
Speed still adds context. A fast return through a level often makes rejection clearer than a move that spends a long time building outside before rotating back. That evidence may strengthen the description without guaranteeing what happens next.
Why the Sweep Story Feels So Convincing
Liquidity language can make a messy event feel intentional and complete. Instead of saying, “The breakout failed,” the trader can say smart money engineered a stop hunt to trap retail before reversing the market. The second explanation sounds more sophisticated, but it also contains many more assumptions.
Several order types and participants can interact near the same price. Breakout entries may execute, stops may trigger, resting liquidity may meet aggressive orders, existing positions may exit, and opposing traders may enter. The chart shows the result—not everybody's motive.
This connects directly with Break of Structure (BOS) vs. CHOCH. A structural break can satisfy a predefined BOS rule and then fail to produce continuation. The break happened; what changed afterward was the quality of the continuation evidence.
Order Flow Can Add Evidence, Not Certainty
At a suspected sweep, order-flow tools can help study pressure and response around the level. A trader may ask whether aggressive buyers are still gaining ground above the high, whether heavy buying is producing little progress, or whether selling begins responding as price returns through the reference. Those observations can refine the read.
They still do not prove institutional intent or guarantee reversal. The broader Order Flow Trading framework remains the right foundation: footprint, delta, depth, tape, and volume are evidence layers rather than automatic signals. More detailed data should help answer a question, not replace one story with a more technical-looking story.
A Sweep Does Not Guarantee Reversal
Suppose ES trades above the prior high, quickly falls back beneath it, and the trader immediately shorts because “liquidity was taken.” Price then stabilizes, reclaims the high, and accelerates upward. The initial rejection happened, but the sustained reversal the trader predicted did not.
A sweep can lead to a meaningful reversal, temporary pullback, deeper retest, rotation, or renewed breakout. The failed breakout can itself fail when price returns inside, cannot continue, and then reclaims the level. Do not replace “breakout means buy” with “sweep means fade.”
Timeframe and market state change how much weight the event deserves. A one-minute sweep may be noise inside a clean 15-minute breakout, while rejection at a major hourly or previous-day level may be more meaningful. Reviewing the three market states helps because repeated level crossings inside chop should not receive the same interpretation as a clean rejection at an important reference.
Observation, Interpretation, and Prediction
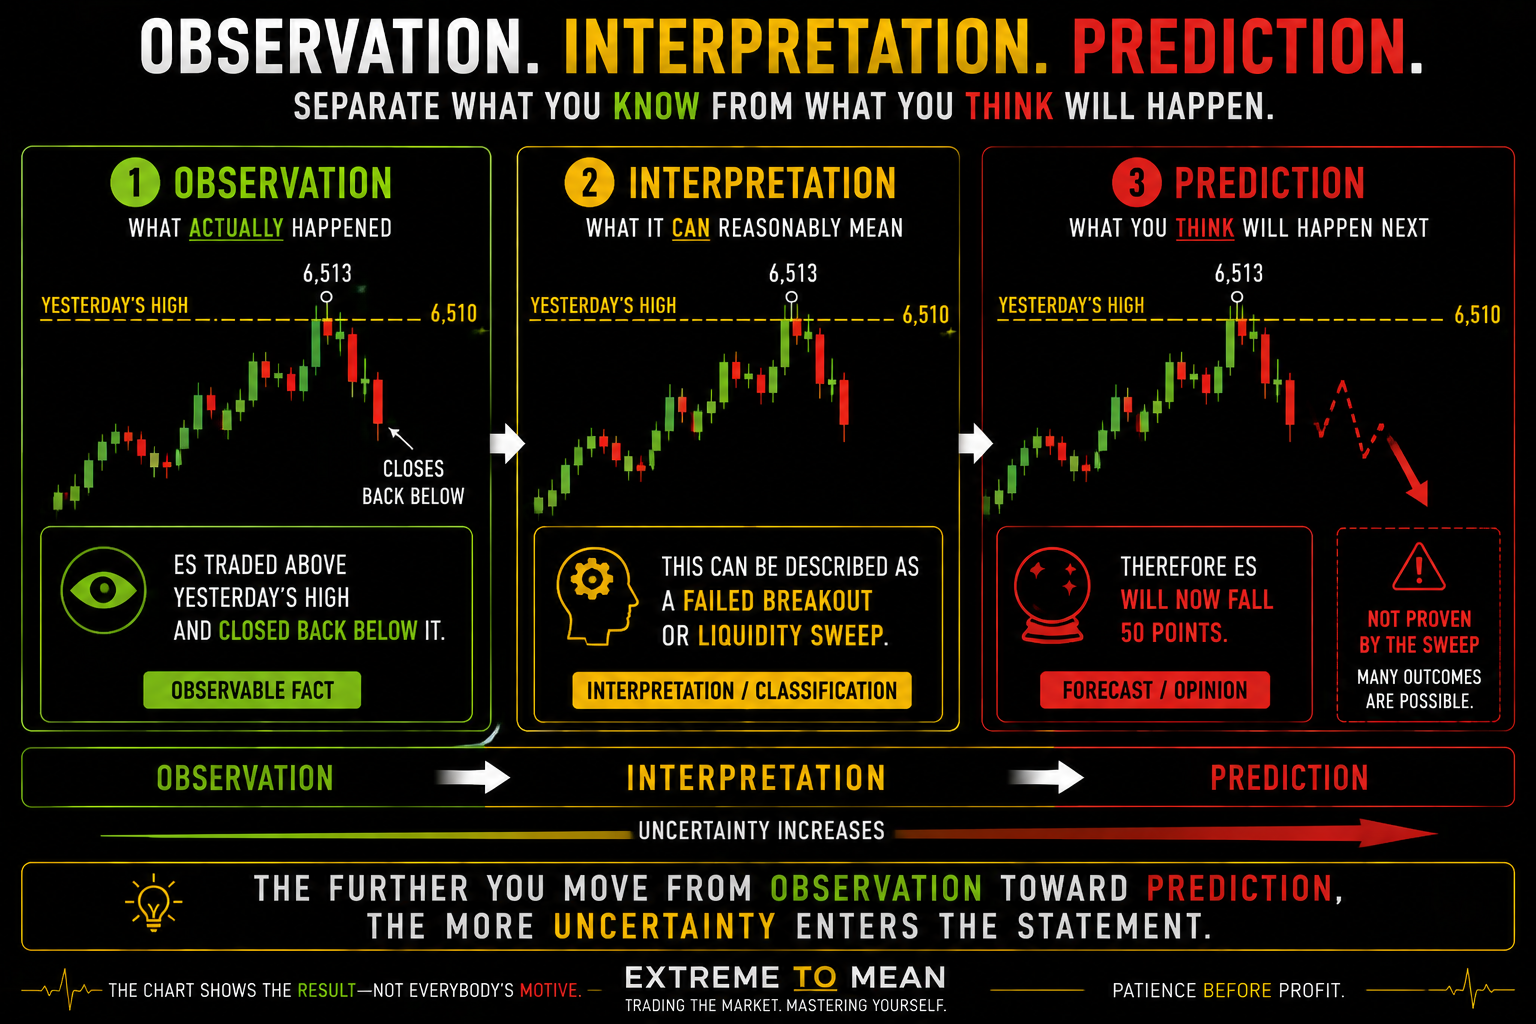
A useful discipline is separating three layers. Observation: ES traded above yesterday's high and then closed back beneath it. Interpretation: the move can reasonably be described as a failed breakout or liquidity sweep.
Prediction: therefore ES will now fall 50 points. That is a different kind of statement because it moves from describing what happened to forecasting what must happen next. The further you move from observation toward prediction, the more uncertainty enters the statement.
Complex terminology can make uncertain evidence feel certain without adding information. Your job is not to tell the most impressive story about the wick; your job is to decide what the market actually proved. That is a better foundation for deciding whether the event deserves risk.
A Practical Liquidity-Sweep Framework
Use Level → Probe → Response → Acceptance/Rejection → Structure → Risk. The sequence keeps the event in context and prevents the first trade through a level from becoming an automatic signal. A sweep is information before it is a setup.
- Level: Why does this high, low, or boundary matter?
- Probe: Did price actually trade beyond it?
- Response: What happened immediately afterward?
- Acceptance or rejection: Did price remain beyond the level or return through it?
- Structure: Did the move create continuation, structural failure, or no clean conclusion?
- Risk: Is there now an actual setup with definable invalidation, or merely an interesting chart event?
| Question | Genuine Breakout | Failed Breakout / Sweep |
|---|---|---|
| Trades beyond the level? | Yes | Yes |
| Sustains beyond it? | More evidence of acceptance | Limited or no |
| Follow-through? | Develops | Fails or weakens |
| Returns inside quickly? | Less characteristic | More characteristic |
| Guarantees continuation/reversal? | No | No |
| Automatic entry signal? | No | No |
The better question is not “Was liquidity taken?” Ask, “What did price actually prove after it crossed the level?” Then ask whether the response produced acceptance, rejection, meaningful structure, and a trade with clear enough invalidation to deserve risk.
Final Thought
Liquidity-sweep terminology can be useful when it describes price trading through an obvious reference and then failing to establish itself beyond that level. The mistake is turning the description into certainty about motive, manipulation, or what price must do next. Crossing the level is the event; what price does after crossing it is the information.
Obvious highs and lows attract attention, but the chart does not reveal everybody's stops or intentions. A sweep can reverse sharply, fail to reverse, or become part of a renewed breakout. Rejection is evidence; it is not destiny.
Before fading the next wick through a high or low, ask whether the market has actually shown rejection, whether that rejection matters on the relevant timeframe, and whether a real setup formed afterward. That habit of separating observation from storytelling is part of the broader context-first process developed in Decode the Market.
Educational content only. Trading involves substantial risk and is not suitable for everyone.