
A Fair Value Gap, usually shortened to FVG, is a three-candle price pattern commonly used in ICT and Smart Money Concepts-style analysis. The pattern can be defined mechanically, which makes it useful as a chart reference, but that precision does not make the future reaction certain. Inside The Market, the cleaner approach is to use the zone as evidence and context rather than treating the rectangle itself as an entry signal.
For a plain-English guide to the broader terminology around these patterns, see ICT Trading Concepts Explained.
What a Fair Value Gap Actually Is
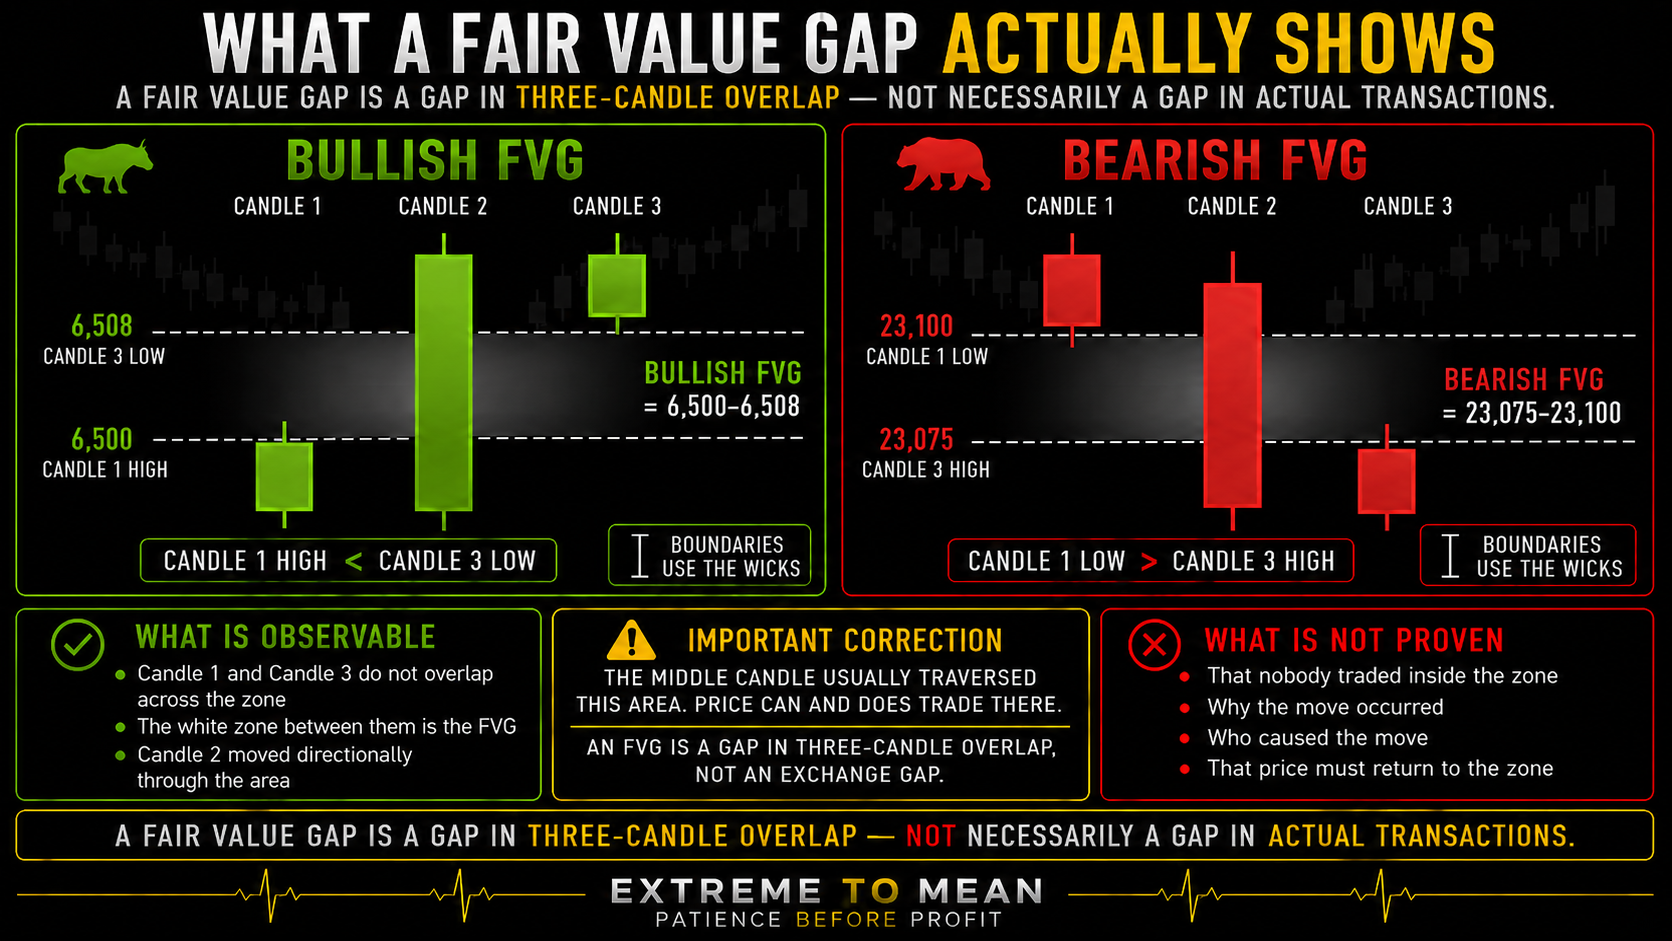
A bullish FVG is commonly defined by a three-candle sequence where the high of Candle 1 is below the low of Candle 3. The price zone between those two levels becomes the bullish Fair Value Gap. The middle candle is usually part of a strong upward move, although the mechanical definition itself does not require one universal minimum candle size.
Suppose ES prints a first candle with a high of 6,500, then moves sharply higher on Candle 2, and Candle 3 has a low of 6,508. Because Candle 3 never overlaps Candle 1 across 6,500–6,508, that zone would commonly be labeled a bullish FVG. The observable fact is simply that the first and third candles did not overlap across that price area.
A bearish FVG reverses the relationship. If Candle 1 has a low of 23,100, price moves sharply lower, and Candle 3 has a high of 23,075, the 23,075–23,100 zone can be labeled a bearish FVG. The pattern tells you how the three candles relate to one another; it does not automatically tell you what price must do afterward.
The “Gap” Usually Does Not Mean Nobody Traded There
One of the most important corrections is that a Fair Value Gap is generally not the same thing as an exchange gap where no trades occurred between two separated price areas. In the bullish ES example, price moved through 6,500–6,508 during the directional middle candle. The FVG exists because Candle 1 and Candle 3 do not overlap across the zone.
That makes the phrase “price skipped those prices” misleading. In a liquid futures market, transactions can occur while the middle candle travels through the FVG area even though the surrounding outer candles leave the three-candle non-overlap. A Fair Value Gap is a gap in three-candle overlap—not necessarily a gap in actual transactions.
The word fair value deserves similar restraint. The label does not mathematically establish intrinsic value, economic equilibrium, or a price where the market is obligated to return. It names a trading-framework concept defined by a particular candle relationship.
Why Traders Pay Attention to FVGs
FVGs often form during fast directional movement, so traders may use the resulting zone as a reference when price later retraces. The common theory is that the market moved quickly through the area and may later revisit it as more two-sided trading develops. Within ICT-style terminology, that revisit may be described as rebalancing or mitigation.
The important word is may. The presence of an FVG does not guarantee a revisit, and a revisit does not guarantee a favorable reaction. Statements such as “all FVGs eventually fill” are too broad to function as a useful trading rule without defining timeframe, instrument, fill method, time horizon, and what happened before the supposed fill.
A claim that FVGs fill 80%, 90%, or some other percentage is incomplete without methodology. Does touching the nearest edge count, must price reach the midpoint, or is the opposite boundary required? A statistic becomes useful only after the pattern and outcome have been defined precisely enough to test.
Filled, Partially Filled, and Consequent Encroachment
Assume a bullish FVG spans 6,500–6,510. If price later touches 6,510 and leaves, one trader may describe the gap as touched while another would say virtually nothing was filled. If price reaches 6,506, the zone was partially revisited but still did not reach the opposite boundary.
The midpoint is 6,505. Within ICT terminology, that 50% level is often called Consequent Encroachment, or CE. Giving the midpoint a specialized name does not make it predictive; mathematically it is still simply the midpoint of the defined zone.
This matters when reviewing results because different definitions create different statistics. One trader may call a move to the midpoint “mitigated,” while another may require a complete move through the zone before calling it filled. Define the measurement before evaluating whether the pattern “worked.”
The Existence of an FVG Is Not the Importance of an FVG
Once traders learn to identify FVGs, lower-timeframe charts can quickly become covered with rectangles. Bullish gaps, bearish gaps, nested gaps, partially filled gaps, inverse gaps, and higher-timeframe zones can create the impression that every part of the chart has special meaning. Clutter can look like precision without improving the decision.
Relevance depends on context. An FVG created by a meaningful directional move around established structure may deserve more attention than a tiny gap created during random one-minute chop. Reviewing how market conditions change the quality of a setup helps prevent identical-looking rectangles from being treated as identical trades.
Timeframe matters for the same reason. A 15-minute FVG may reflect a larger move than a one-minute FVG, but that does not make every higher-timeframe zone automatically stronger or every lower-timeframe zone useless. The significance of the box has to fit the market process in which it is being used.
The Same FVG Can Exist in Very Different Contexts
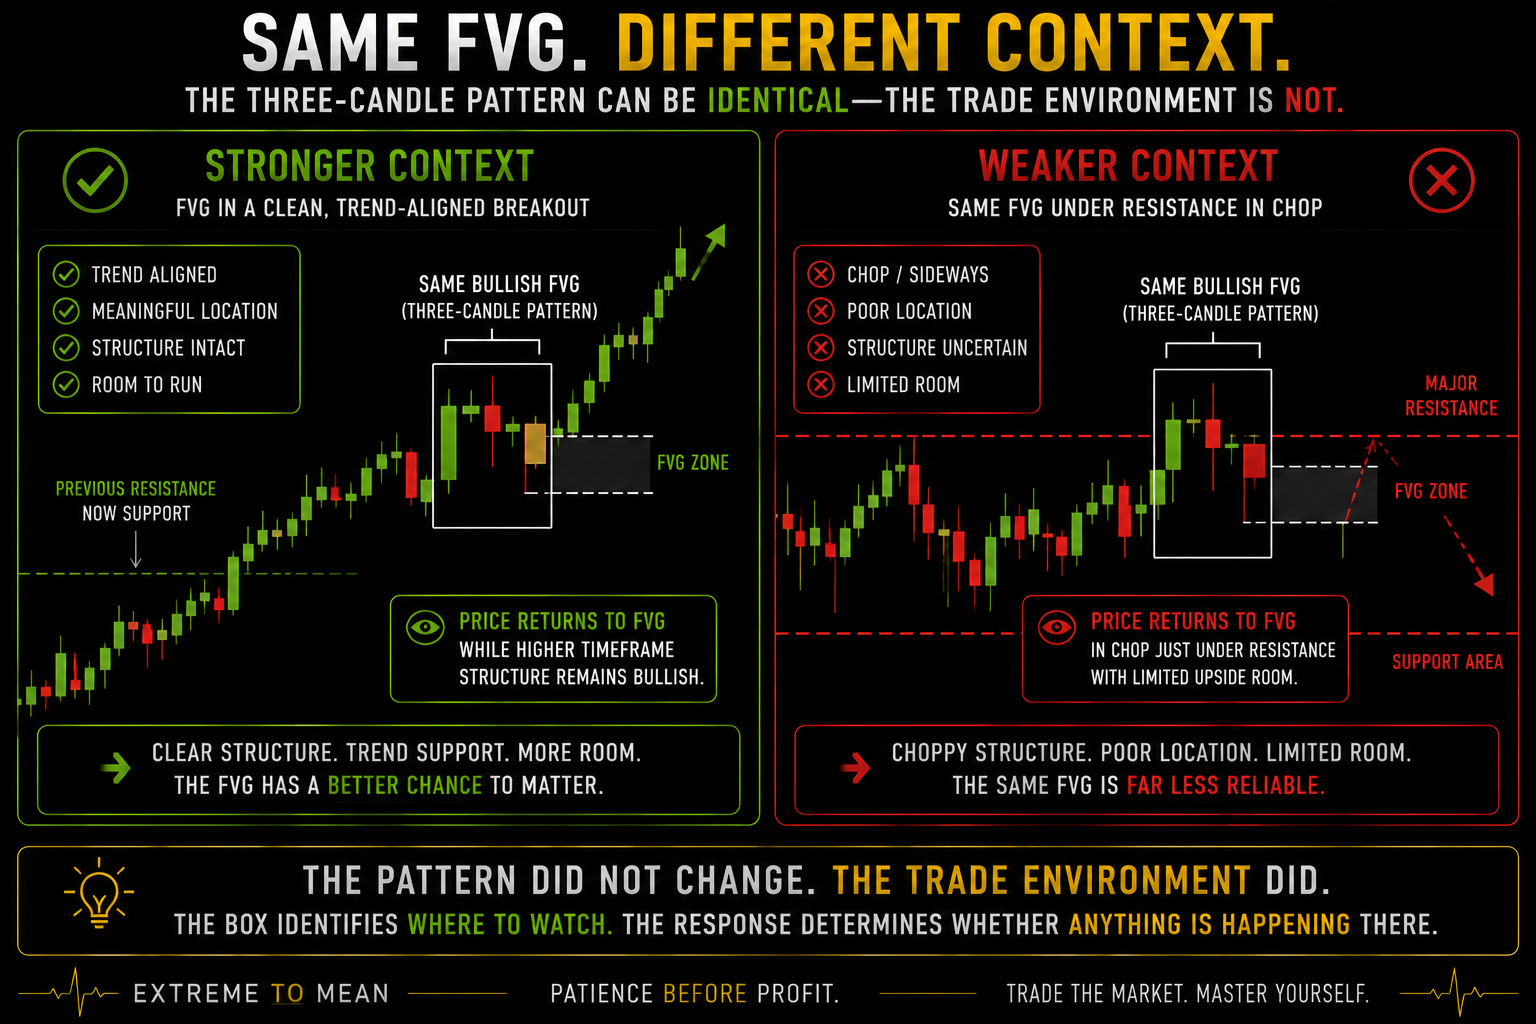
Imagine NQ creates a bullish FVG during a clean higher-timeframe uptrend immediately after breaking meaningful resistance. Structure remains intact, momentum continues, and price later retraces toward the zone while holding above the breakout area. That is one market environment.
Now imagine the exact same three-candle pattern forming directly beneath major resistance during overlapping chop after an extended move. The candle relationship is still mechanically valid, but the trade environment is completely different. The pattern stayed the same; the trade did not.
That is why the better use of an FVG is often as an area to study rather than a command to act. Ask where it formed, what structure surrounds it, whether the larger market changed, and what price actually does when it returns. The rectangle identifies a location; the reaction provides new information.
FVG, BOS, and Liquidity Sweep Describe Different Things
A Fair Value Gap describes the relationship among three consecutive candles. A BOS or CHOCH describes what price did relative to previously defined market structure. The two concepts can appear in the same move, but neither requires the other.
A strong directional break may create an FVG while also satisfying a structural-break definition. That does not mean the FVG caused the BOS or that every BOS must leave a gap. The distinction from BOS and CHOCH matters because structure and three-candle non-overlap are separate observations.
A liquidity sweep is different again. It describes price trading through an important high or low and failing to maintain the excursion, while an FVG describes a three-candle pattern that may form almost anywhere. The liquidity-sweep framework should remain separate rather than being turned into a mechanical “sweep → FVG → reversal” sequence.
An FVG Is Not the Same as Order-Flow Imbalance
FVG traders frequently use the word imbalance, but candlestick imbalance and executed order-flow imbalance are not the same measurement. The FVG shows that Candle 1 and Candle 3 did not overlap across a zone. It does not directly measure bid volume, ask volume, delta, or the identity of participants.
A large bullish middle candle may be consistent with aggressive buying, but the candle alone does not prove the exact order-flow mechanism behind the move. Every completed trade still had both a buyer and seller. The prices at which those counterparties were willing to transact changed; the chart does not tell you that “buyers existed and sellers disappeared.”
If deeper transaction information matters to the decision, the broader Order Flow Trading framework is the appropriate toolset. Footprint, delta, tape, volume, and market depth can add evidence about participation. They still do not convert the FVG into certainty.
Does an FVG Reveal Institutional Orders?
A three-candle chart pattern cannot identify who placed the trades that produced it. It cannot prove that institutions were entering rather than exiting, hedging rather than speculating, or that unfilled institutional orders remain inside the rectangle. Those claims add information the candles themselves do not contain. The same evidence standard applies when evaluating what order blocks can actually show.
Some trading methodologies interpret FVGs as areas where strong one-sided activity or large participants may have contributed to rapid movement. That interpretation can be explained as part of the framework without presenting it as observable fact. The FVG pattern is visible; participant identity and future order intent are not.
This distinction is important because specialized language can make a hypothesis sound measured. A box marked 6,503.25–6,507.75 looks exact, but exact boundaries do not create exact forecasts. Precise measurement does not create predictive certainty.
Fair Value Gaps Can Fail
Suppose a bullish FVG forms from 6,503 to 6,508 during an ES rally. Price later returns into the zone, trades through 6,503, continues below the surrounding structure, and keeps selling. The FVG existed; it simply did not produce the bullish reaction the trader hoped to see.
The wrong response is to say it was never a “real” FVG because it failed. If it met the trader's predefined three-candle definition, the pattern was valid as a classification. A failed FVG does not invalidate the definition; it invalidates the assumption that the definition guaranteed the reaction.
Screenshots can hide this problem because traders naturally save the clean reactions. Perfect midpoint bounces, immediate continuations, and textbook reversals are more memorable than gaps that are ignored, blown through, filled much later, or react too little to support a useful trade. A pattern should be evaluated across a complete sample rather than through its best examples.
A Fill Is Not Automatically a Trade
Consider an FVG from 6,500 to 6,510. Price returns to 6,505, rallies to 6,512, and then falls through 6,500 to 6,498. Someone measuring midpoint touches can record that the FVG “respected CE,” but that observation says little about whether a trade was actually usable.
A strategy still needs an entry rule, invalidation, target, timing, costs, and enough room for the idea to make sense. The pattern statistic and the economics of a complete trading method are different questions. “FVGs tend to fill” is not a trading system.
That difference also explains why testing matters more than collecting screenshots. The trader should define what counts as an FVG, what counts as a fill, how long the fill window remains open, what price behavior qualifies an entry, and when the thesis is invalidated. Otherwise the rules can quietly change after seeing the result.
A Practical FVG Framework
Use Move → FVG → Context → Return → Response → Decision. The purpose of the sequence is to keep the rectangle in its proper place: between identifying the pattern and deciding whether anything useful is actually happening there. The box identifies where to watch; the response determines whether anything is happening there.
- Move: What market behavior created the pattern?
- FVG: Where exactly is the objectively defined three-candle zone?
- Context: What do trend, structure, volatility, location, and market condition say?
- Return: Does price actually revisit the zone?
- Response: What happens when price gets there?
- Decision: Is there now a qualified trade with definable risk, or merely a marked rectangle?
| Question | What the FVG Can Tell You | What It Does Not Prove |
|---|---|---|
| Three-candle relationship | Candle 1 and Candle 3 do not overlap across the zone | Why the move occurred |
| Directional middle candle | Price traveled strongly through the area | Institutional identity |
| Exact boundaries | Where the pattern begins and ends | That the zone is “true fair value” |
| Return to the zone | Price revisited the area | That a reversal or continuation must follow |
| Midpoint touch | Price reached 50% of the FVG | Predictive power |
| Full fill | Price reached the opposite edge | That the trade was profitable |
| Failure through the zone | Expected reaction did not develop | That it was never a valid FVG |
The better question is not “Is there an FVG here?” Ask, “Does this FVG matter in this market, at this location, on this timeframe—and what is price actually doing when it reaches the zone?” The more confident the rectangle makes you feel, the more important it is to look for evidence beyond the rectangle itself.
Final Thought
Fair Value Gaps are useful because they give traders a precise way to describe one specific three-candle relationship. A bullish or bearish FVG can identify a zone created during directional movement and give the trader a place to study if price returns. That does not require pretending the zone contains hidden orders or that price is obligated to fill it.
The name is more dramatic than the underlying observation. It is a gap in three-candle overlap, not necessarily a gap in actual transactions, and “fair value” does not establish where price objectively belongs. A perfectly drawn box can still represent an imperfect trading idea.
Before trading the next FVG touch, ask whether you are responding to the box itself or to the combination of location, structure, context, and price response around it. That distinction between recognizing a pattern and qualifying a trade is part of the broader process developed throughout Decode the Market.
Educational content only. Trading involves substantial risk and is not suitable for everyone.