
Most new traders see candles before they understand candles. They notice green and red bars, long wicks, large bodies, small bodies, and sudden changes in shape. Then they quickly start looking for signals, patterns, reversals, and reasons to act.
That is understandable, but it skips the first step.
A candlestick is not automatically a setup. It is not automatically a signal. It is not a prediction tool by itself. A candle is simply a way to organize price behavior during one selected period of time.
At Extreme to Mean, this belongs in The Basics lesson library because a trader needs to understand what a single candle represents before trying to understand structure, reversion, entry quality, or risk. If a trader cannot explain the open, high, low, and close, the rest of the chart can feel more complicated than it needs to be.
A Candlestick Shows One Period of Price Action
A candlestick represents price movement during one specific period.
That period could be one minute, five minutes, fifteen minutes, one hour, one day, one week, or another timeframe depending on the chart settings. If you are looking at a five-minute chart, each candle summarizes five minutes of price movement. If you are looking at a daily chart, each candle summarizes one trading day.
This is why a candle should never be separated from its timeframe. A large candle on a one-minute chart may not mean the same thing as a large candle on a daily chart. The shape may look similar, but the amount of time being summarized is completely different. The next step is understanding how timeframe changes what each candle represents.
It also helps to understand how the session close affects candle interpretation, because the close is part of what gives a candle its final shape.
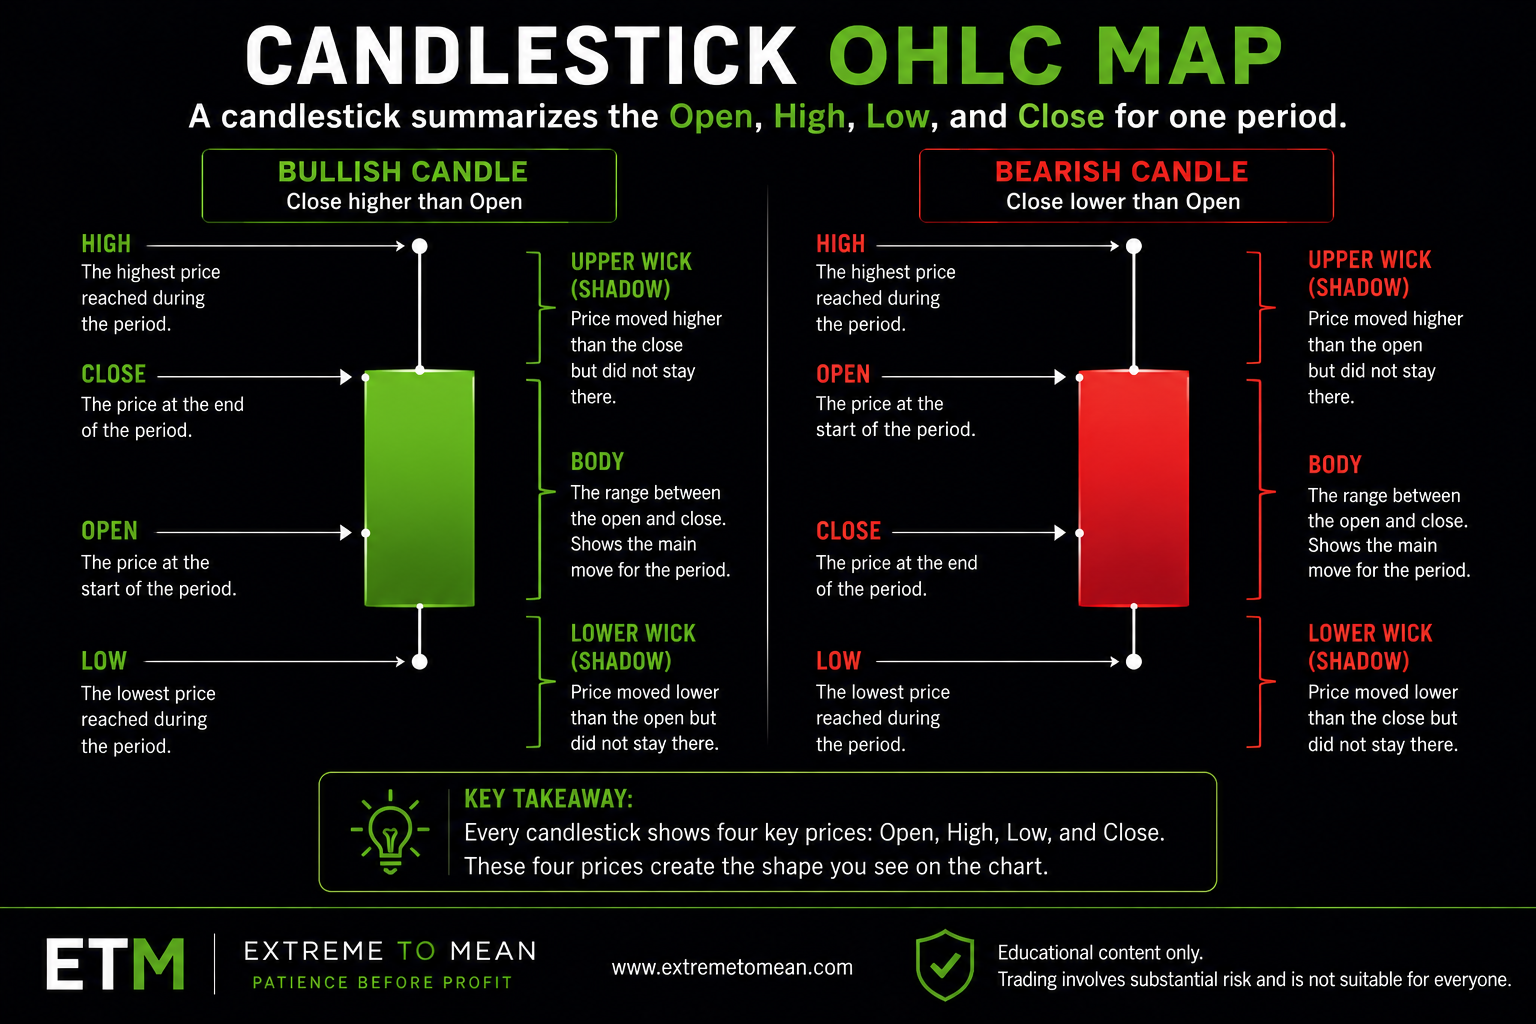
Every candlestick gives the trader four basic pieces of information:
- The open: where price started the period.
- The high: the highest price reached during the period.
- The low: the lowest price reached during the period.
- The close: where price ended the period.
Those four prices are often shortened to OHLC: open, high, low, close.
Before a trader tries to interpret the candle, they should first understand what information the candle is showing. The candle is not giving an instruction. It is giving a visual summary of what happened during that period.
If the earlier lesson on what a price chart is explains price on a timeline, a candlestick explains one small segment of that timeline.
The Open and Close Create the Body
The main rectangle of a candlestick is called the body.
The body shows the distance between the open and the close. In plain English, it shows where price started the period and where price finished the period. If the body is large, price moved a meaningful distance between the open and the close. If the body is small, price opened and closed near the same area.
A candle that closes above its open is often shown in green, white, or another “up” color depending on the chart settings. This means price finished the period higher than where it started. A candle that closes below its open is often shown in red, black, or another “down” color. This means price finished the period lower than where it started.
The color is not magic. It simply compares the close to the open.
A green candle does not mean the next candle must go higher. A red candle does not mean the next candle must go lower. The color only tells the trader what happened inside that one period.
This distinction matters because beginners often react emotionally to candle color. A green candle can feel like strength. A red candle can feel like danger. But one candle’s color does not answer whether the location is good, whether risk is clear, or whether the market context supports a decision.
The body helps the trader see who had more control between the open and close of that period. But it does not tell the whole story by itself.
The High and Low Show the Full Range
The thin lines above and below the candle body are usually called wicks or shadows.
The upper wick shows how high price reached during the period before closing somewhere below that high. The lower wick shows how low price reached during the period before closing somewhere above that low. Together, the high and low show the full range of price movement during the candle.
This matters because the body only shows the open-to-close relationship. The wick shows that price may have traveled beyond the body before finishing the period.
For example, a candle may open, push much higher, then close near where it started. If you only looked at the body, it might seem like not much happened. But the upper wick tells you price moved higher during the period and then failed to hold that higher area by the close.
Another candle may open, drop sharply, then recover before closing near the top of its range. The lower wick tells you sellers pushed price down during the period, but price did not stay there by the close.
This does not mean the candle is automatically bullish, bearish, or tradable. It means the trader has more information about the path price took during that period.
The wick helps answer a better question: “Where did price travel, and where did it actually finish?”
That question keeps the trader focused on observation before interpretation.
Color and Shape Describe Behavior, Not Certainty
Candlestick color and shape can be useful, but they should not be treated as certainty.
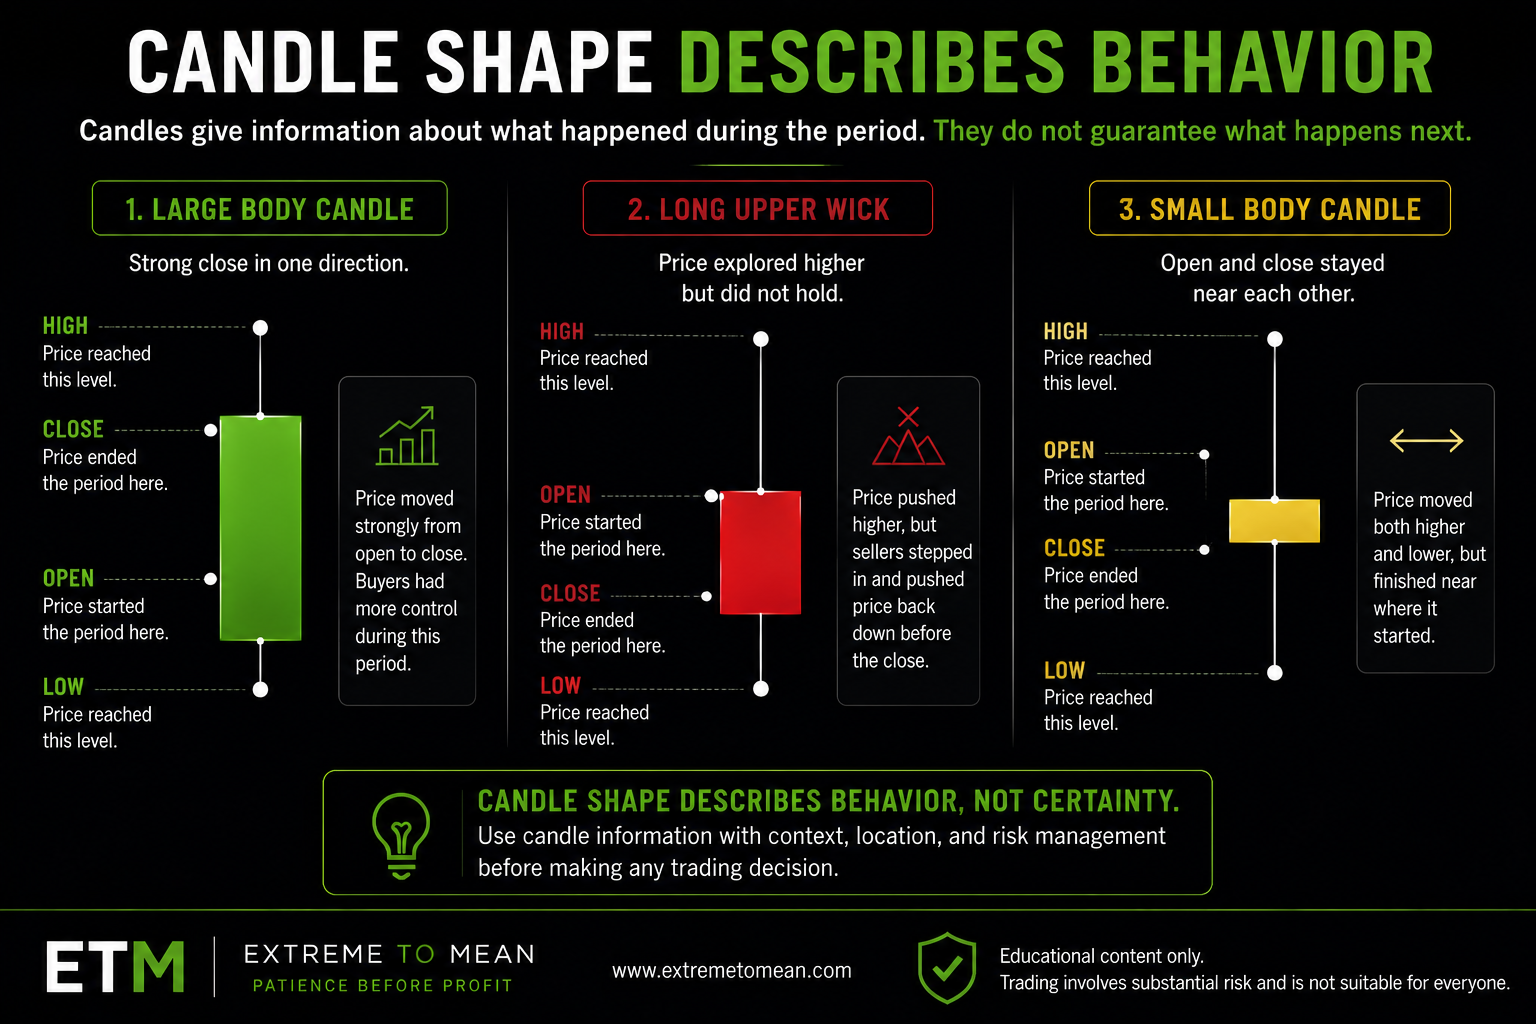
A large green candle shows that price closed well above where it opened. That may suggest strong buying during that period, but it does not guarantee that buyers will remain in control. A large red candle shows that price closed well below where it opened. That may suggest strong selling during that period, but it does not guarantee that sellers will keep control.
A small-bodied candle may show hesitation, balance, or a period where price moved but closed near where it started. A candle with long wicks may show that price explored higher, lower, or both, but did not hold all of that movement by the close.
The key word is “may.”
Candles describe behavior. They do not guarantee meaning.
This is where many traders get into trouble. They memorize candle names or patterns and start treating every shape like an instruction. They see a wick and assume rejection. They see a large candle and assume continuation. They see a small candle and assume indecision.
Sometimes that interpretation may be reasonable. Other times it may be incomplete. The candle still needs context.
Where did the candle form? Was price near an important area? Was the market trending, ranging, or extended? Did the candle appear after a slow move, a sharp move, or a messy chop? Was the candle part of a larger structure, or just one isolated bar?
This is why Extreme to Mean teaches traders to evaluate before acting. A candle can earn attention, but attention is not the same as risk.
The earlier lesson on buyers, sellers, and price helps here because candles are simply the visual result of that auction process. Buyers and sellers interact during the period, price moves, and the candle records the result.
One Candle Is Not the Whole Chart
A single candlestick can be useful, but it is still only one piece of information.
Beginners often zoom in too closely. They see one candle and immediately try to decide what it means. A strong candle feels like confirmation. A wick feels like rejection. A color change feels like a signal. That reaction is natural because candles make price movement easy to see.
But one candle does not show the whole market.
A green candle inside a weak market may not mean the same thing as a green candle after a clean pullback into structure. A red candle in the middle of a range may not mean the same thing as a red candle breaking below an important level. The candle is the same color, but the surrounding context is different.
This is one of the most important beginner lessons: the candle is not the trade.
A trader still needs to understand direction, location, context, and risk. The lesson on long and short trade direction explains that direction only tells the trader which way a trade benefits. A candlestick adds more detail about price behavior, but it still does not complete the decision.
A better trader does not ask only, “What candle is this?”
A better trader asks, “Where did this candle form, what happened before it, and does it change the quality of the decision?”
That question is slower, but cleaner. It keeps the trader from reacting to one candle without understanding the larger chart.
A Simple Candlestick Reading Filter
Before using a candle to support any decision, a beginner should be able to read it in plain English.
Start with these questions:
- What timeframe does this candle represent?
- Where did the candle open?
- Where did the candle close?
- What was the highest price reached?
- What was the lowest price reached?
- Is the body large or small?
- Are the wicks long, short, or uneven?
- Did price close near the high, near the low, or near the middle?
- What happened before this candle?
- Is this candle giving information, or am I treating it like a signal?
These questions help separate reading from reacting.
The goal is not to turn every candle into a trade idea. The goal is to understand what the candle is showing so the trader can make a more organized decision. If the candle is unclear, the trader does not need to force a conclusion. Sometimes the most disciplined answer is, “This does not give me enough information.”
That is part of Patience Before Profit.
A candlestick can help a trader see price behavior more clearly, but the decision still has to be earned. The trader still needs a reason, a location, and a defined risk. Without those pieces, reacting to a candle is still reacting.
For traders building the full foundation, the best next step is to start with the beginner trading path before trying to turn candle shapes into setups.
Final Thought
A candlestick shows four basic things: the open, high, low, and close for a specific period of time.
The body shows the relationship between the open and the close. The wicks show the full high-to-low range. The color shows whether price closed above or below where it opened.
That information matters, but it is still descriptive. A candle shows what happened during a period. It does not guarantee what happens next, and it does not replace context, location, or risk management.
The better trader does not look at one candle and immediately react. The better trader reads the candle, places it in context, and asks whether the information is strong enough to support a decision.
That is how candlesticks become useful.
Educational content only. Trading involves substantial risk and is not suitable for everyone.