
Many traders learn to call the VIX the “fear index” and begin treating every high reading as panic and every low reading as complacency. That shortcut feels useful because it turns a complex options-based measure into a simple market opinion. The problem is that fear is not measured directly, and the same VIX level can appear during very different market conditions. A useful reading begins by understanding what the index was designed to represent.
The lessons in The Market category emphasize that one indicator should be interpreted inside the environment surrounding it. The VIX may confirm that expected volatility is expanding, stabilizing, or falling, but it cannot explain the complete market by itself. Price, structure, participation, liquidity, and related markets still determine how that information should affect a trade decision. The trader’s job is to evaluate the relationship rather than react to the number.
Breadth, volatility, and risk appetite together offer a broader market-health framework than the VIX alone.
What the VIX Is Designed to Measure
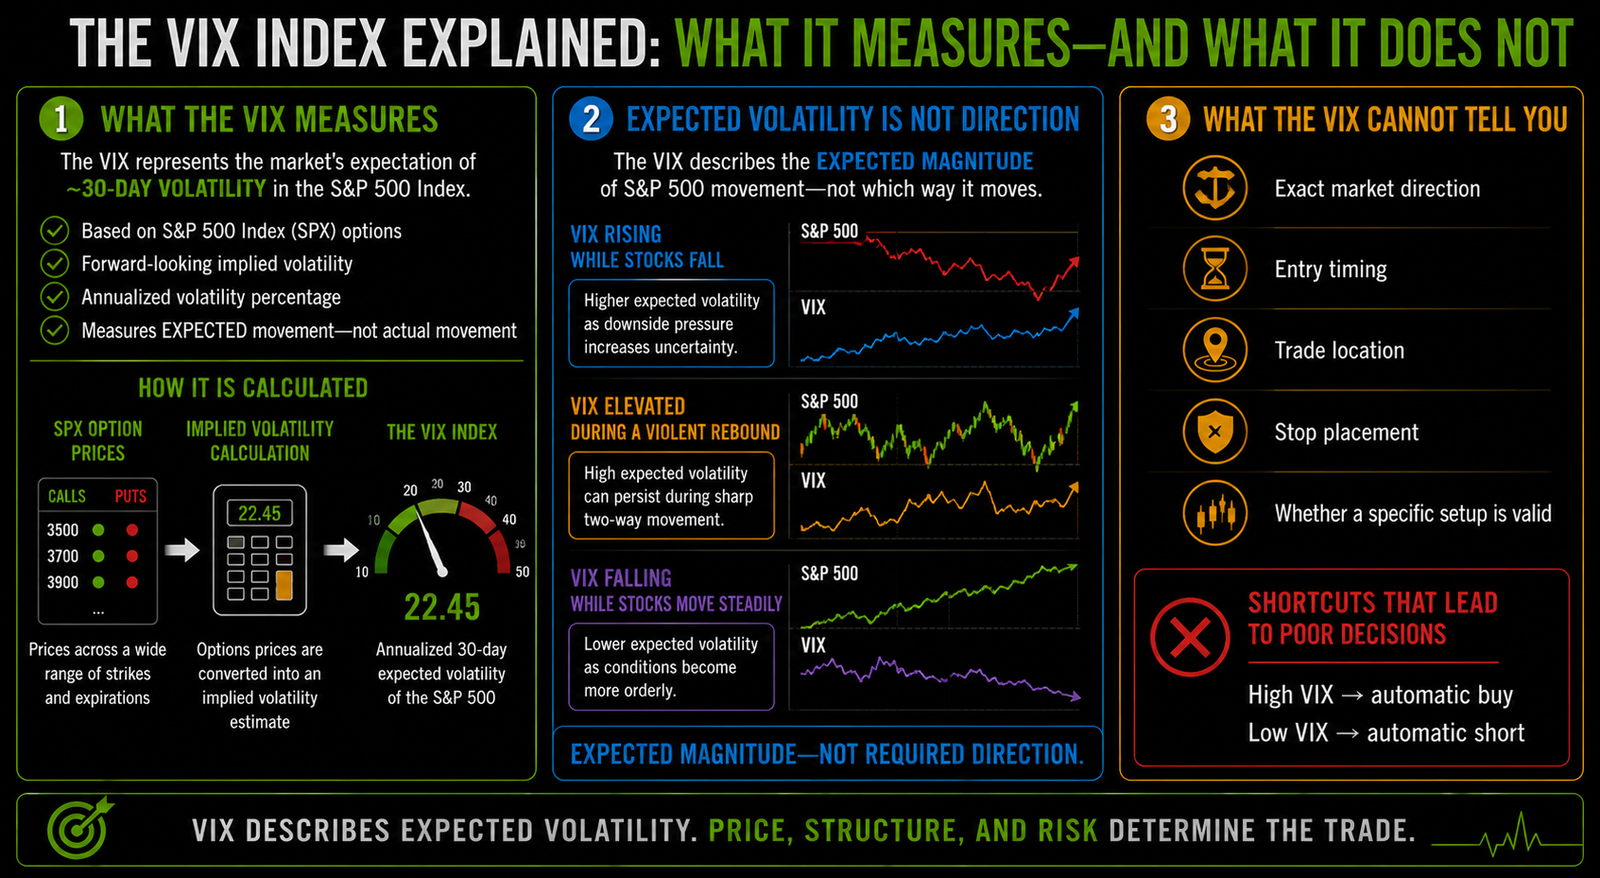
The VIX is designed to represent the options market’s expectation of approximately 30-day volatility in the S&P 500. It is calculated from a broad range of S&P 500 Index option prices across multiple strikes. Those prices reflect how much the options market is charging for exposure to a wider or narrower range of potential outcomes. The result is a forward-looking estimate of expected movement rather than a record of volatility that has already occurred.
The VIX is expressed as an annualized volatility percentage, which can be confusing for newer traders. A VIX reading near 20 does not mean the S&P 500 is expected to move 20 percent during the next month. It represents an annualized estimate that can be translated into a smaller expected range over shorter periods. The number is most useful as a relative volatility reference rather than as a direct price target.
Why the “Fear Index” Label Is Incomplete
The “fear index” nickname comes from the tendency of implied volatility and demand for options protection to rise during periods of market stress. That relationship is common enough to make the nickname memorable. It is still incomplete because the VIX measures expected volatility rather than an emotion recorded directly from investors. Uncertainty, event risk, positioning, and changing demand for options can all affect the reading.
A high VIX can accompany fear, forced hedging, unstable liquidity, or a market attempting to price a wide range of possible outcomes. A low VIX can appear during calm conditions, steady trends, contained event risk, or confidence that current uncertainty is manageable. Neither state guarantees what price will do next. The nickname can help traders remember the index, but it should not become the trading rule.
Expected Volatility Is Not Direction
The VIX describes the expected magnitude of S&P 500 movement, not whether that movement must be higher or lower. A rising VIX often appears during equity declines because downside pressure can increase demand for protection. It can also remain elevated during violent rebounds, major events, or unstable two-way trading. Direction must still be determined through price and market structure.
The same separation applies when the VIX falls. Declining implied volatility may accompany a steady rally, a quiet decline, a range, or the resolution of an event that had been priced aggressively. A lower reading indicates that the options market is assigning a narrower distribution of possible outcomes than before. It does not automatically mean that stocks are safe, bullish, or approaching a reversal.
Level and Rate of Change Tell Different Stories
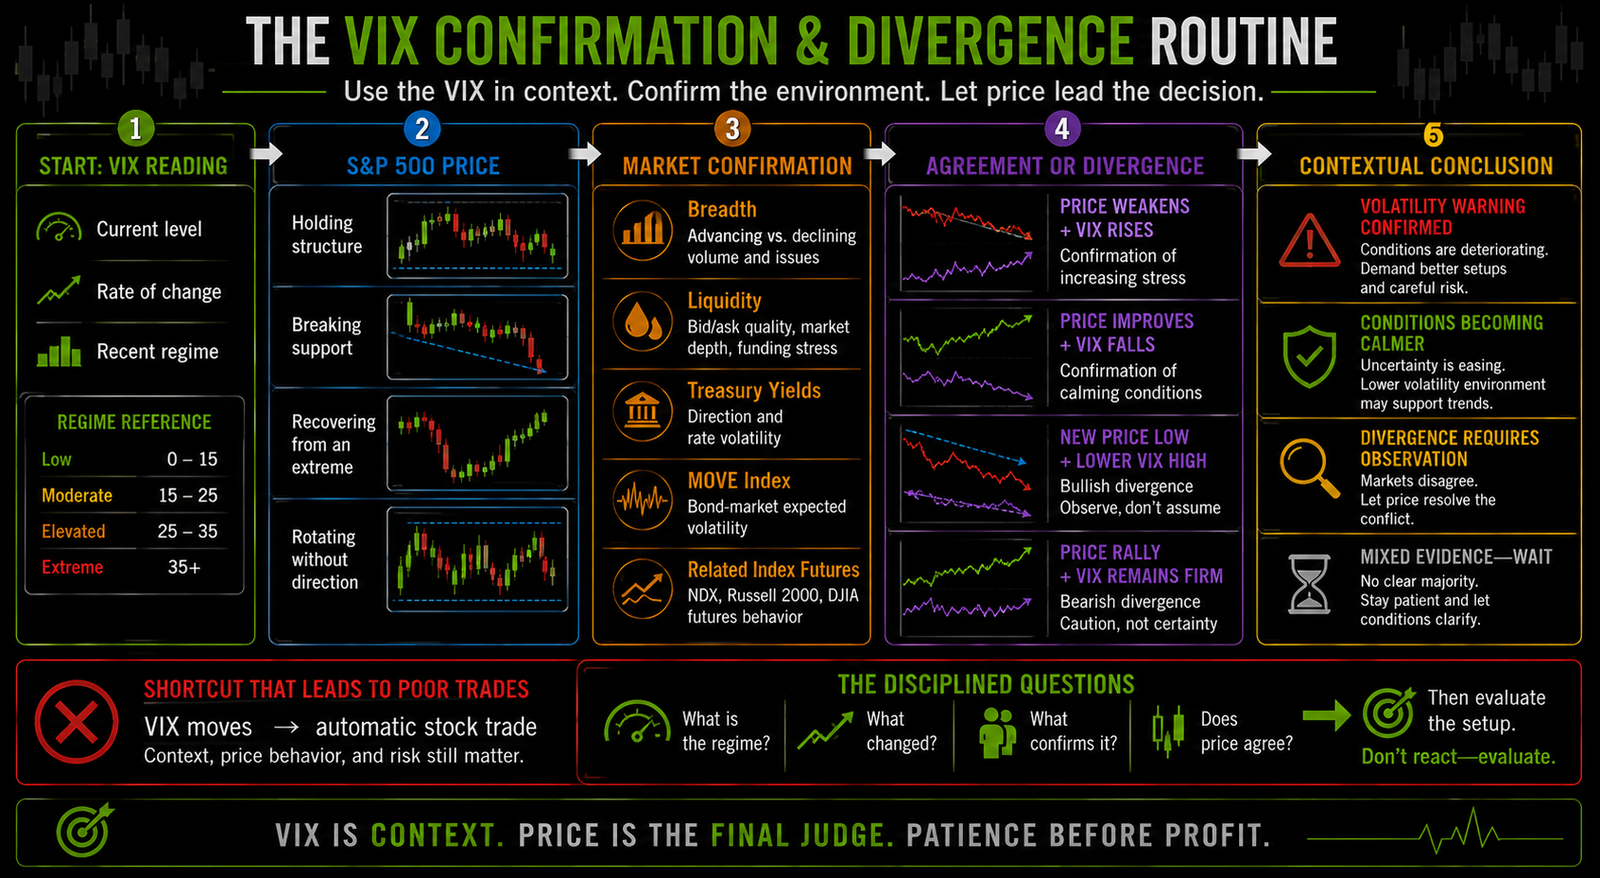
The VIX level helps describe the current volatility regime, while its rate of change shows how quickly expectations are shifting. A reading of 22 may appear elevated after several months near 13 but ordinary after a period spent above 30. The number gains meaning when it is compared with its recent range, trend, and surrounding conditions. A fixed threshold can hide those differences.
A rapid move from 14 to 20 may matter more in the moment than a stable reading near 25. The first example shows volatility expectations expanding quickly, while the second may show that elevated uncertainty has already become established. Traders should ask what changed, how quickly it changed, and whether the move is accelerating or stabilizing. The speed of repricing can provide more immediate context than the absolute number alone.
The Same VIX Reading Can Mean Different Things
Volatility regimes change over time, so the same VIX level can carry different meaning in different environments. A reading of 25 reached during a sudden equity selloff is different from a reading of 25 after volatility has declined steadily from 50. One reflects expanding uncertainty, while the other may reflect stress that is easing but remains elevated. The level is identical, but the market process behind it is not.
This is why traders should examine the path rather than attach a permanent label to one number. The recent baseline, direction of change, speed of movement, and reason for the repricing all matter. A reading that once represented unusual stress may later become normal for that regime. Context determines whether the level is changing the environment or merely describing it.
Confirmation and Divergence Improve the Read
The VIX becomes more useful when its movement agrees with changes already developing in price and related markets. Rising VIX alongside weakening index structure, broader selling, unstable liquidity, and deteriorating participation can strengthen a risk warning. Falling VIX alongside improving breadth, orderly pullbacks, and price acceptance can confirm that conditions are becoming less defensive. Confirmation improves the market description without guaranteeing the next move.
This is where the principle that context comes before the candle becomes practical. A fast VIX spike should not replace the structure of the index future or stock being traded. The trader still needs to see whether price is breaking, rejecting, accepting, or rotating around important areas. VIX strengthens the context only when the traded market responds in a way that supports the same conclusion.
Divergence can also become informative. If the S&P 500 makes a new low while the VIX fails to make a corresponding high, downside uncertainty may not be expanding at the same pace as the price decline. If equities rally while the VIX remains firm or begins rising, the options market may not be fully accepting the apparent calm. Either disagreement creates a question that price must answer rather than an automatic reversal signal.
What the VIX Cannot Tell Traders
The VIX cannot tell a trader whether an entry is at a meaningful location. It cannot define the stop, measure the available room, identify the exact reversal point, or prove that the setup’s structure is complete. A market-wide volatility reading may improve context while the individual trade remains late, poorly located, or impossible to size. Trade qualification still belongs to price structure and the risk plan.
This is why market conditions change the quality of a setup without replacing the setup itself. A familiar pattern may require stronger evidence when volatility is expanding rapidly, while a quieter regime may produce smaller movement and more overlap. The VIX can help explain why the surrounding environment has changed. It cannot grant permission to enter.
The VIX also cannot tell traders exactly when volatility will peak or collapse. A high reading can remain elevated, and a low reading can persist while price continues trending. Traders who assume that an extreme VIX level must reverse immediately can become early in the same way that traders become early fading an extended price move. Extension creates attention before it creates a decision.
Read VIX With Price and Related Markets
The VIX should be read with the S&P 500, index futures, breadth, liquidity conditions, Treasury yields, bond volatility, and other relevant markets. Each input answers a different question, and agreement can strengthen the description of the environment. Disagreement may reveal that uncertainty is concentrated, temporary, or not yet reflected in price. The goal is not to force every market into one story.
The lesson on how the stock market actually moves explains why auctions, liquidity, and participation remain central. The VIX may show that options markets expect larger movement, but the auction still determines where buyers and sellers accept price. A higher volatility estimate can accompany clean directional movement or unstable reversals. Price behavior reveals which environment is actually developing.
A Simple VIX Reading Routine
A practical routine begins by identifying the current VIX level and comparing it with the recent volatility regime. The trader then reviews the rate of change, the direction of the S&P 500, and whether related markets confirm the same message. The final step is to return to the traded chart and determine whether price behavior agrees. This sequence keeps the VIX in a contextual role:
- Level: Is the VIX low, moderate, or elevated relative to its recent regime?
- Change: Is it rising, falling, or stable, and how quickly is that change occurring?
- Price: Is the S&P 500 accepting lower prices, holding structure, or rotating without direction?
- Confirmation: Do breadth, liquidity, rates, MOVE, or related indexes support the same conclusion?
- Divergence: Is price making a new extreme without a comparable VIX response?
- Decision: Does the actual setup have location, structure, room, and clear invalidation?
The better question is not, “Is the VIX high enough to buy or low enough to short?” It is, “What volatility regime is present, what changed inside it, and does price confirm the same environment?” That question turns the indicator into part of a structured market read. The setup must still earn risk through its own evidence.
Common VIX Mistakes
One common mistake is treating a high VIX as an automatic contrarian buy signal. Another is treating a low VIX as proof that the market must soon fall because traders have become complacent. Traders may also assume that rising VIX guarantees falling equities or that declining VIX confirms a safe rally. These shortcuts ignore the regime, rate of change, market structure, and actual behavior of price.
Another mistake is reacting to the VIX without understanding what created the move. A scheduled event, sudden decline, options-positioning change, or broad liquidity problem may produce very different market behavior. The VIX reading should begin an investigation rather than finish the conclusion. The cleaner process describes the conditions first and evaluates the trade second.
From One Volatility Gauge to a Broader Framework
VIX becomes more useful when it is connected with bond volatility, rates, the dollar, liquidity, participation, and index structure. The related lesson on the MOVE Index shows why uncertainty in interest-rate markets can confirm or disagree with equity volatility. When VIX and MOVE rise together while price structure weakens, the warning may be broader. When they diverge, the trader should investigate rather than force a conclusion.
Readers who want to build that broader cross-market process can continue through Decode the Market. The book connects macro conditions, market relationships, and the evidence visible on the chart. VIX belongs inside that framework as one measure of expected equity volatility. It should not replace price, structure, or risk management.
Final Thought
The VIX measures expected S&P 500 volatility, not fear itself and not market direction. Its level helps describe the regime, while its rate of change shows how quickly volatility expectations are shifting. Confirmation and divergence can improve the market read when they are tested against price and related markets. None of those observations creates a complete trade by itself.
The goal is not to turn the VIX into an automatic buy, sell, or reversal signal. Ask what the level means in the current regime, how quickly it changed, what confirms it, and whether price agrees. The VIX can strengthen context or expose disagreement, but the chart still determines location, structure, and invalidation. The trader’s job is to evaluate that evidence before deciding whether the setup has earned risk.
Volatility is only one part of a broader stock market crash-warning review, which also requires participation, credit, liquidity, rates, and price structure.
Educational content only. Trading involves substantial risk and is not suitable for everyone.