
Traders often search for one indicator that will show when price has moved too far and is ready to reverse. That search feels reasonable because lines, bands, profiles, and oscillators make market behavior easier to compare. The danger begins when a useful reference becomes automatic permission to trade. Extension does not prove exhaustion, timing, or a safe entry.
The lessons in The Setup category treat indicator readings as evidence inside a larger decision process. A tool can direct attention toward an opportunity, but it cannot replace context, structural confirmation, or clear risk. Our list therefore favors five tools that answer different questions rather than five versions of the same signal. The trader’s job is to understand both what each tool measures and what it leaves unanswered.
What Makes a Mean-Reversion Indicator Useful
A useful mean-reversion indicator compares current price behavior with a meaningful reference. That reference may describe an average, a volatility-adjusted boundary, an accepted value area, or a momentum condition. The tool improves the decision when it clarifies location and market state. It becomes dangerous when the trader treats the reading as proof that price must reverse.
This ranking reflects the Extreme to Mean approach rather than a claim that the same order is universally best. We give more weight to tools that connect extension with context, structure, and decision quality. A narrower tool can still be valuable when its job is understood clearly. The better question is not, “Which indicator wins?” but, “What question does this indicator help me answer?”
1. The TMT System
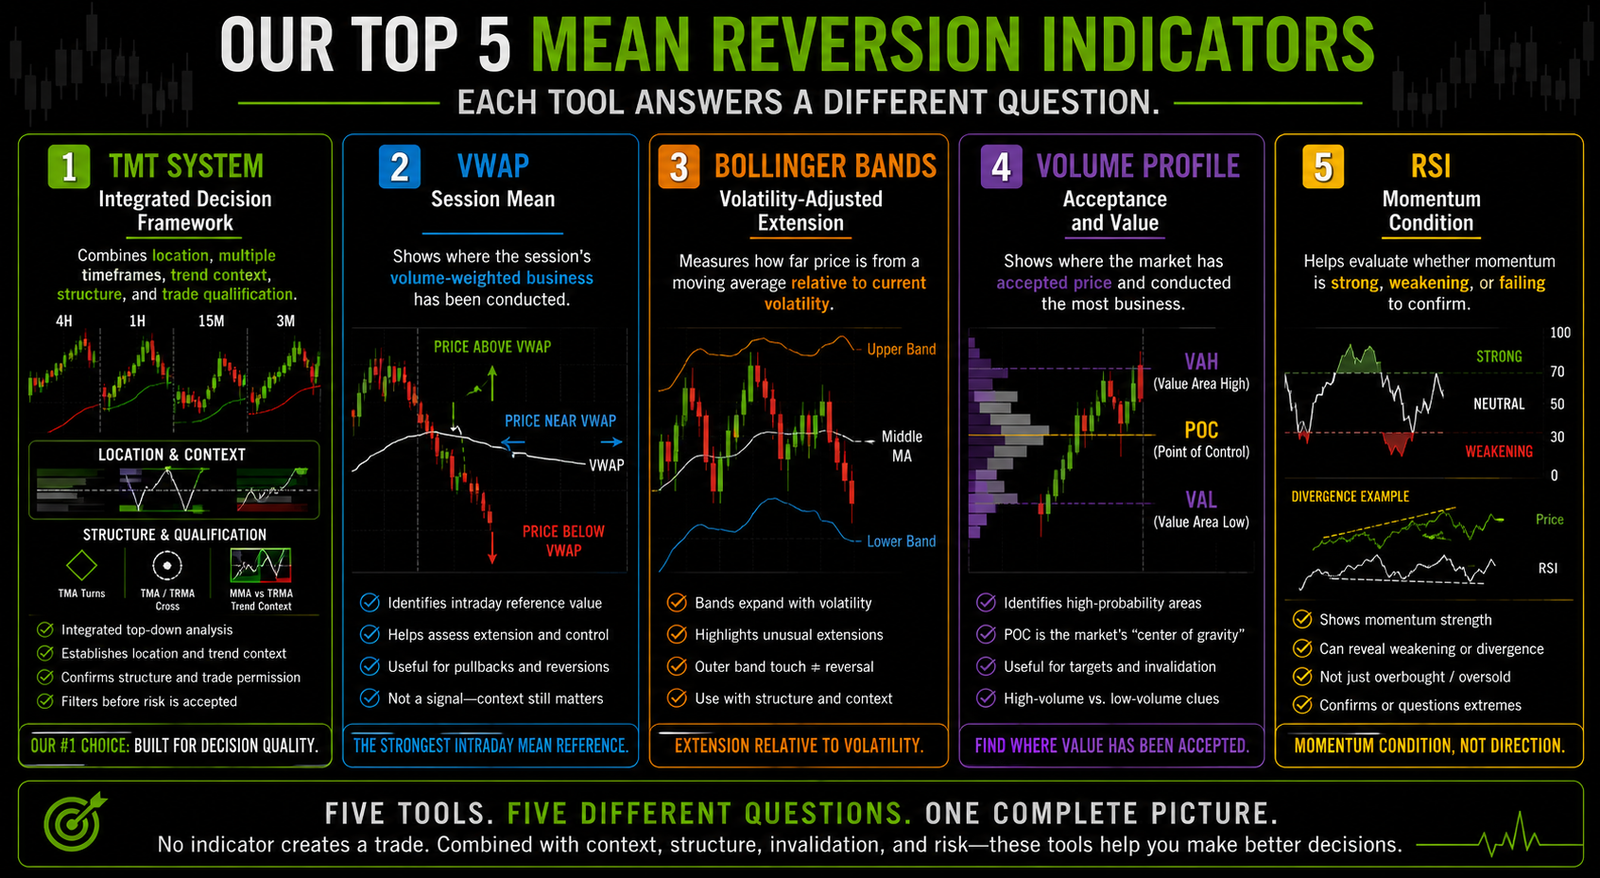
The TMT System is our number-one mean-reversion framework because it does not reduce the decision to one line or oscillator. It organizes multiple timeframes, location, trend context, structure, and trade qualification into one connected read. That matters because an extreme can appear while the broader market remains strongly directional. This article does not disclose proprietary formulas, thresholds, settings, or signal logic. The broader Extreme to Mean system shows how location, context, and qualification fit together.
2. VWAP
VWAP, or volume-weighted average price, is a widely available intraday mean reference. It shows where the session has conducted volume-weighted business and whether price is above, below, or near that average. The full VWAP mean-reversion lesson explains why distance from the line is not an automatic fade signal. Trend days can remain extended, while balanced sessions may cross VWAP repeatedly. VWAP is most useful before the trader evaluates structure, timing, and invalidation.
3. Bollinger Bands
Bollinger Bands provide a volatility-adjusted view of extension around a moving average. The bands expand as recent volatility increases and contract when movement becomes quieter, making them more adaptive than a fixed distance. An outer-band move can show that price is unusually far from its recent average relative to current conditions. It does not prove that the move is exhausted, because price can continue walking the band during a strong trend. The trader still needs evidence of slowing progress, rejection, or a structural shift back toward balance.
4. Volume Profile
Volume Profile shows how much trading activity occurred at different prices rather than only by time. Common references include the Point of Control, Value Area High, Value Area Low, and high- or low-volume areas. These levels describe accepted value, possible destinations, and locations where rejection may matter. Low-volume areas may allow faster travel, while high-volume areas may attract rotation. These are tendencies, not guarantees, because the market can build value elsewhere.
5. RSI
The Relative Strength Index, commonly called RSI, helps describe momentum condition. Traders often focus on overbought and oversold readings because those labels appear to offer simple reversal signals. A cleaner use is to ask whether momentum remains strong, begins weakening, or fails to confirm a new price extreme. Strong trends can keep RSI elevated or depressed while price continues making progress. Divergence can direct attention toward changing momentum, but it does not prove that structure has reversed.
Why These Five Work Together
These tools work well together because each answers a different part of the mean-reversion question. The TMT System organizes the broader decision, while the others describe session mean, volatility, accepted value, and momentum. Several tools measuring the same thing can create apparent confirmation without adding much information. A stronger process looks for complementary evidence.
- TMT System: Do location, trend, structure, and permission align?
- VWAP: Where is price relative to the intraday session mean?
- Bollinger Bands: How unusual is the extension relative to current volatility?
- Volume Profile: Where has the market accepted value and conducted business?
- RSI: Is momentum still supporting the move?
The tools do not need to agree perfectly. Price may be far from VWAP and outside a Bollinger Band while RSI remains strong and Volume Profile shows acceptance at new prices. Even the Point of Control remains an activity reference rather than a guaranteed destination. That conflict is useful because it identifies extension without clear exhaustion, and the market description improves when disagreement is allowed to matter.
An Indicator Is a Reference, Not Permission
No indicator can guarantee that a move will reverse, identify the exact turning point, or prove that a trade will work. A reading is built from price, volume, or both, so it describes information that has already developed. It may reveal an unusual condition or changing behavior, but it cannot remove uncertainty. The indicator should begin a sequence of questions rather than end the decision.
Indicators also cannot define risk unless the trader connects them to market structure. A stop placed only because a line was crossed or an oscillator changed may have little relationship to the trade’s logic. The trader still needs to explain what behavior proves the idea wrong and how that invalidation affects position size. As the risk lesson explains, the trade is not ready until the risk is clear.
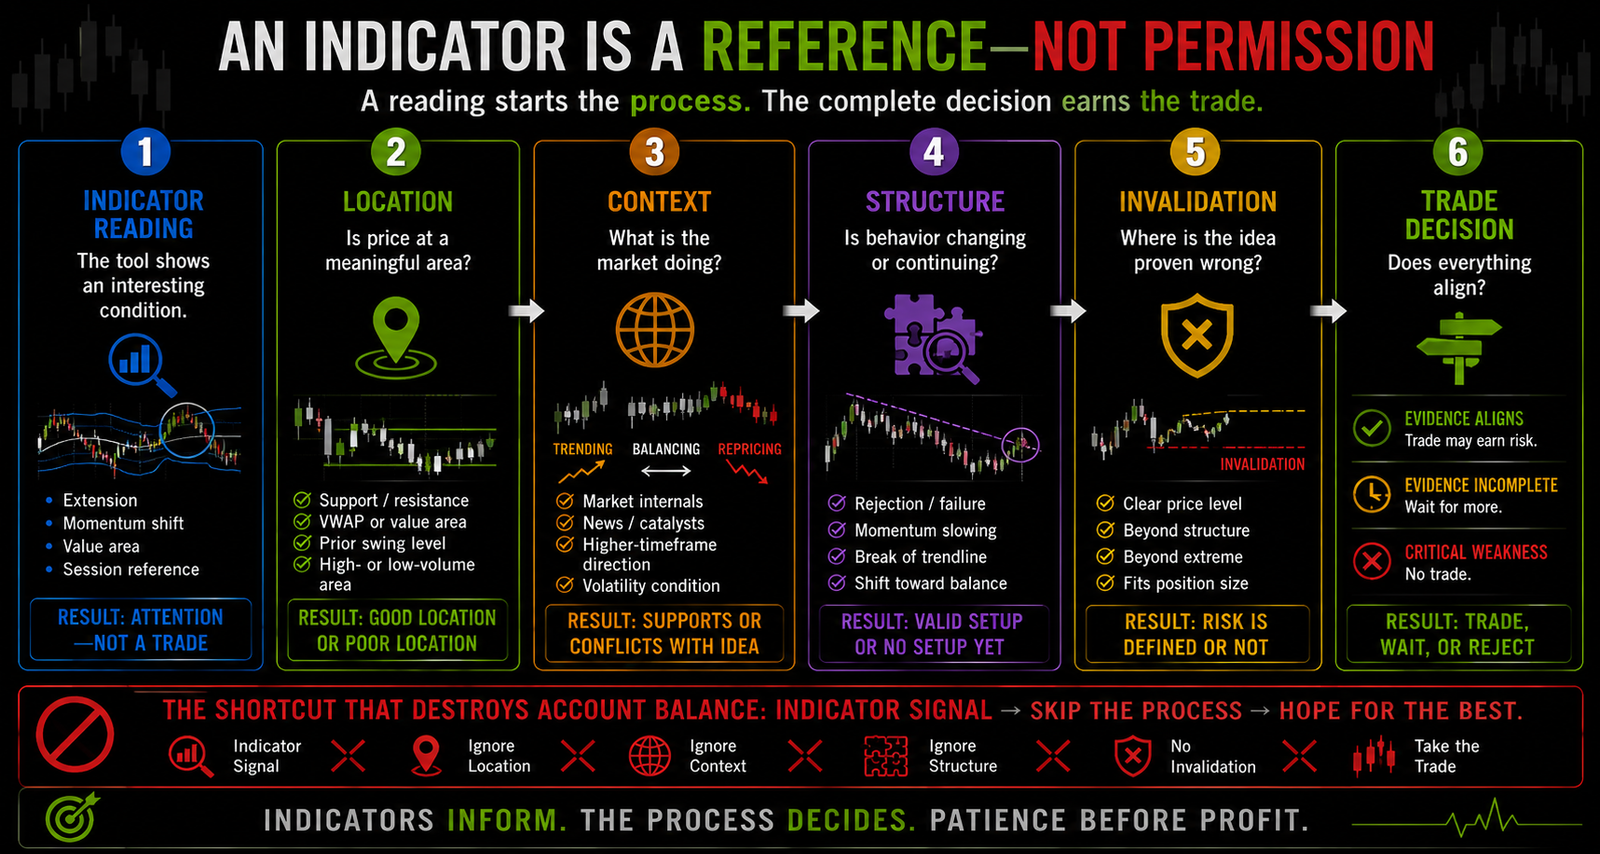
The decision sequence should move from the indicator reading to location, context, structure, invalidation, and position size. This follows the principle that location is the first filter. A strong reading at a poor location can still produce a weak trade, while a meaningful location without structural evidence may require patience. The setup earns attention before it earns risk.
Other Useful References
Moving averages remain useful because they compare price with a smoothed reference. They already support Bollinger Bands and many integrated frameworks, but add less unique information here than Volume Profile or RSI. Session midpoints, prior balance areas, opening ranges, and previous highs or lows can also matter. Their absence from the top five does not make them unimportant.
Avoid Turning Five Tools Into Five Reasons to Trade
More indicators do not automatically create a better decision. A crowded chart can encourage the trader to search until one tool supports the trade already desired. The process then becomes permission-seeking rather than evaluation. A smaller set of tools with clearly separated jobs is easier to use consistently.
The trader should also avoid changing settings after every missed move or losing trade. Constant adjustment can make the tools fit recent outcomes without improving the underlying process. The cleaner approach is to define what each indicator contributes and review whether that information was used correctly. Flexibility should come from changing market evidence, not from rewriting the tool after the result is known.
A Practical Indicator Review
Before using an indicator reading in a mean-reversion trade, the trader can apply a short review. The questions should connect the reference to the market rather than merely confirm that a line, band, profile, or oscillator reached a certain state. One weak answer may require patience, while several weak answers may disqualify the idea. The goal is to determine whether the reading adds useful evidence or only visual urgency:
- What does this indicator measure?
- Is it showing location, volatility, value, momentum, or a combination?
- Is the broader market trending, balancing, or repricing?
- Is the reading occurring at a meaningful structural location?
- Does price behavior show rejection, slowing progress, or a shift toward balance?
- Are several tools adding different information or repeating the same observation?
- What specific behavior proves the reversion idea wrong?
- Is the destination realistic for the timeframe?
- Can position size fit the actual invalidation distance?
- Would the trade still make sense if the indicator name were removed from the chart?
The better question is not, “How many indicators agree?” It is, “What independent evidence does each tool add to the trade explanation?” That question protects the trader from mistaking visual confluence for complete qualification. The broader lesson of what Extreme to Mean really means is that an extreme creates an evaluation problem, not an automatic reversal trade.
Review the Tool Separately From the Outcome
Post-trade review should record what each indicator contributed. The trader may use VWAP correctly for location but treat RSI as a timing signal, or mistake an outer Bollinger Band for exhaustion while Volume Profile shows acceptance. Separating the tools reveals what was useful and what was assumed. The trade result alone cannot provide that diagnosis.
A losing trade does not automatically prove that the indicator failed, and a winning trade does not prove that it was used responsibly. The review should focus on whether each tool answered its intended question and whether the complete trade met the plan. This keeps the trader from replacing process analysis with indicator shopping. Better review improves clarity without pretending that any tool can eliminate uncertainty.
Frequently Asked Questions
What is the best mean reversion indicator for day trading?
There is no single indicator that is best in every market condition. Our top choice is the TMT System because it combines location, trend, structure, and qualification rather than relying on one reading. For traders using public tools, VWAP, Bollinger Bands, Volume Profile, and RSI each answer a different part of the mean-reversion question.
Is VWAP a mean reversion indicator?
VWAP is an intraday reference showing the session’s volume-weighted average price. The comparison of session VWAP with Anchored VWAP explains why the selected starting point changes the question. Traders can use VWAP as a possible mean or destination, but distance from it does not prove that price is ready to reverse. Context, structure, invalidation, and risk still determine whether the idea deserves consideration.
Are Bollinger Bands useful for mean reversion?
Bollinger Bands can help show when price is unusually extended relative to recent volatility. They become more useful when the extension occurs at a meaningful location and price begins showing rejection or slowing progress. Touching an outer band by itself is not an automatic trade signal.
Can RSI predict a reversal?
No. RSI describes momentum condition; it does not predict the exact turning point. Overbought, oversold, or divergent readings can direct attention toward a possible change, but strong trends can keep RSI elevated or depressed while price continues moving.
Should traders use all five indicators at the same time?
Not necessarily. The goal is not to crowd the chart or count how many indicators agree. A cleaner process uses a small number of complementary tools with clearly defined jobs, then evaluates location, context, structure, invalidation, and risk.
Final Thought
Our top five mean-reversion indicators are the TMT System, VWAP, Bollinger Bands, Volume Profile, and RSI because they contribute different types of information. Together they help describe integrated context, session value, volatility-adjusted extension, accepted price areas, and momentum condition. That combination creates a fuller market description than several tools measuring the same thing. It still does not create an automatic trade.
The indicator is the reference, not the permission. Location, context, structure, invalidation, and acceptable exposure remain responsible for the decision. Sometimes the tools will align, sometimes they will conflict, and sometimes they will identify an extreme that continues moving farther. The trader’s job is to evaluate what the readings mean and wait until the complete opportunity has earned risk.
Educational content only. Trading involves substantial risk and is not suitable for everyone.